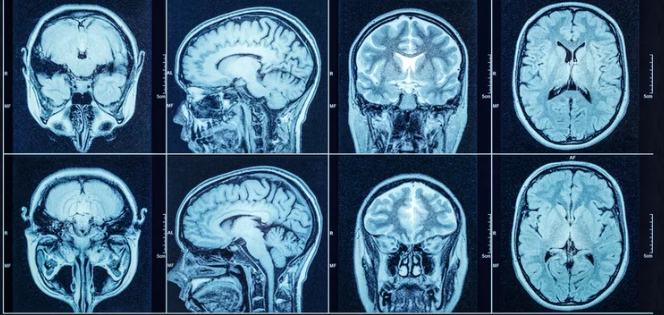
MRI visualization tools are essential for neuroscience research because they help scientists see and analyze brain structures and functions in detail. These tools turn complex MRI data into clear 3D images, making it easier to study how the brain works and how it changes in different conditions. The ability to manipulate and explore MRI data in real time allows researchers to gain deeper insights and make more accurate discoveries.
Technology has advanced to offer user-friendly software that works on various platforms, including web browsers and desktop applications. Many of these tools are open source, making them accessible to a wide range of researchers. This accessibility helps speed up brain research by enabling scientists to collaborate and share data more effectively.
With these tools, researchers can conduct detailed analyses of brain anatomy, track disease progression, and improve surgical planning. The resulting visualizations support better understanding and treatment of neurological disorders, which benefits both science and medicine.
Key Takeways
- MRI tools convert brain scans into detailed images for easier analysis.
- Many visualization tools are accessible and support collaboration.
- These tools aid in tracking brain health and guiding treatments.
MRI Visualization Tools and Techniques
MRI visualization tools offer ways to view and interpret brain scans clearly. They help researchers examine brain structure, analyze data in three dimensions, and mark important regions. These tools are essential for understanding complex neurological information with detail and precision.
Core Features of MRI Visualization Software
MRI visualization software provides basic functions like loading and displaying brain scans from multiple angles. It supports common MRI data formats and allows zooming, rotating, and slicing through images. These tools often include measurement options to assess distances or volumes within the brain.
Many programs come with user-friendly interfaces to help both beginners and experts. Compatibility with different operating systems, such as Windows, Mac, and Linux, ensures wider accessibility. Some software focuses on providing clear image quality to help detect subtle abnormalities or changes in brain tissue.
3D Rendering and Interactive Analysis
3D rendering transforms 2D MRI slices into three-dimensional models. This allows users to view brain anatomy from all sides and better understand spatial relationships between structures. Interactive features let researchers manipulate the 3D model by rotating, zooming, or isolating regions of interest in real time.
Some web-based tools enable these interactions without installing software. They dynamically load the data needed, reducing load times for large MRI datasets. This improves efficiency when working with big data or sharing results across teams.
Segmentation and Annotation Capabilities
Segmentation tools identify and separate specific brain regions or tissue types automatically or manually. This helps isolate areas such as the cortex, white matter, or lesions. Accurate segmentation supports analysis of brain changes related to diseases or treatments.
Annotation features let users label regions directly on the images or models. This is useful for marking significant findings and for educational purposes. Together, segmentation and annotation improve communication of results between researchers, clinicians, and students.
Applications in Neuroscience Research
MRI visualization tools help scientists examine brain structure, function, and microstructure more clearly. These tools enhance the understanding of brain networks, activity patterns, and tissue properties using advanced data display and processing methods.
Mapping Brain Connectivity
MRI visualization tools are essential for mapping brain connectivity. They use data from techniques like Diffusion Tensor Imaging (DTI) to trace the pathways of axons and show how different brain regions connect.
These tools provide 3D images that reveal neural pathways and fiber tracts. Researchers can identify changes in the brain’s connections, which helps in studying neurological diseases or brain development.
By showing connectivity patterns visually, researchers gain detailed insight into network organization. This aids investigations on how brain regions work together during tasks or rest.
Functional MRI Data Interpretation
Functional MRI (fMRI) captures brain activity by measuring blood flow changes. Visualization tools display this data as colored maps overlaying brain images, helping researchers identify active areas during specific tasks.
The tools enable time-based analysis, showing how brain regions interact over time. This helps understand cognitive processes like memory, attention, and decision-making.
Visualizing fMRI data allows the study of how brain function alters in various disorders. It supports clinical research by revealing abnormal activity patterns in diseases such as epilepsy or depression.
Quantitative Analysis Approaches
Quantitative MRI (qMRI) tools provide measurements of brain tissue properties like myelin, iron concentration, and water content. These precise numbers can indicate subtle changes invisible in normal MRI images.
Software such as the hMRI-toolbox assists researchers in processing qMRI data, making the analysis more efficient and reproducible. This improves comparisons across studies and subjects.
Quantitative approaches help detect microstructural changes related to aging, diseases, and injury. They add depth to visualization by combining clear images with measurable brain tissue metrics.
Also Read :
